+86 15633683072
A quenchometer reading and a cooling curve answer two different questions—but the word “quenchometer” is used for both. If your quality system needs to know whether a quench oil will harden a part or crack it, a single cooling-time number does not carry that information. This article separates the two methods, starting from what ASTM D3520 itself says about its limits, and positions the KHR-A Quenchometer on the cooling-curve side of that line.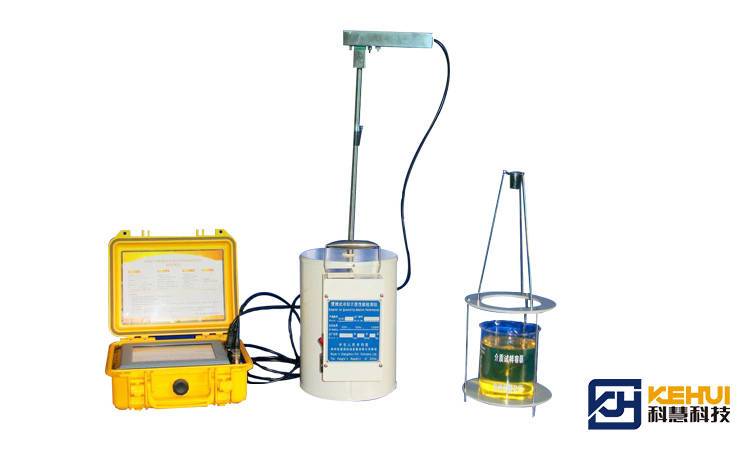
On one quench-oil supplier’s data sheet you see GM quench speed: 10–12 seconds. On another page, “quenchometer” refers to a probe-based instrument that plots a full temperature–time curve and reports maximum cooling rate, 300 °C cooling rate, and characteristic temperatures. These are not the same device, and they do not serve the same decision.
The first belongs to the GM Quenchometer family—ASTM D3520, the Magnetic Quenchometer Method. The second belongs to cooling curve analysis—ISO 9950 and ASTM D6200, the probe-based method that records the entire cooling pathway rather than a single endpoint. For anyone responsible for quenching media in heat treatment, mixing the two up is not a semantic quibble. It determines whether your quench oil testing tells you “this oil is still in the medium-speed category” or “this oil has developed a low-temperature cooling profile that is now cracking parts.”
This article draws that line, using the standards themselves.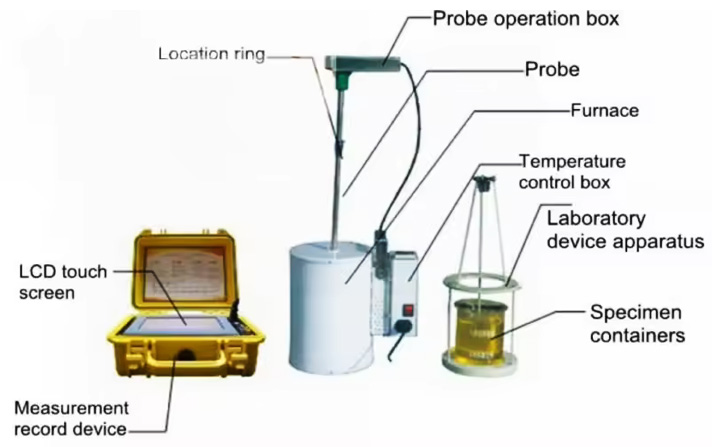
The GM Quenchometer method is specified in ASTM D3520. The test heats a nickel ball—7/8 inch, approximately 22 mm—to 885 °C, quenches it into a 200 mL sample of the test fluid, and measures the total time for the ball to cool to the Curie temperature, approximately 354 °C. A magnetic sensor detects the Curie point, and the elapsed time is reported in seconds.
That single number has been used for decades to classify quench oils into speed bands: fast oils at 8–10 seconds, medium oils at 11–14 seconds, slow oils at 15–20 seconds, and marquench oils at 18–25 seconds. The classification is operationally useful—it tells a shop whether an oil is broadly suitable for a given hardenability range. The method’s endurance reflects a real need: it is fast, inexpensive, and requires no curve interpretation.
What ASTM D3520 measures is also explicitly bounded. The standard states that it “measures changes in the quenching speed characteristics of petroleum fluids at the high temperature (>354 °C)” and that it “does not reliably predict metallurgical performance.” That is not a competitor’s characterization. It is the standard’s own scope statement. The method detects gross shifts in oil chemistry—contamination, base oil degradation, additive drag-out—but it compresses the entire cooling history into one time value and does not resolve what happens below the Curie point, where martensite forms and cracking risk concentrates.
Quench failures do not happen at one temperature. They happen in specific stages of the cooling sequence. When a hot part enters a quenchant, cooling passes through a vapor blanket stage (slow cooling while a vapor film insulates the surface), a nucleate boiling stage (the film collapses and heat extraction peaks), and a convection stage (the surface is below the boiling point and cooling slows). Soft spots typically trace to a vapor blanket that persists too long or is locally trapped—often at a surface where inadequate quench agitation leaves a stagnant vapor pocket. Cracking and distortion concentrate in the low-temperature region, where the cooling rate through the martensite transformation window governs the thermal gradient and the resulting stress.
A GM Quenchometer time is the cumulative time from 885 °C to 354 °C. It does not tell you how long the vapor stage lasted, where the maximum cooling rate occurred, or how fast the oil was cooling at 300 °C. Two oils can return the same GM seconds and behave completely differently in the low-temperature region. One may be safe for a given section size; the other may produce quench cracking because its cooling rate is too fast where it matters.
Water contamination makes the gap concrete. Water in quench oil above 0.05% is associated with soft spots and distortion; above 0.1%, parts can crack or fail. Yet the effect is not uniform across the temperature range. Studies of water-contaminated oils note that the cooling rate “does not vary much at higher temperature range,” while the influence on distortion and cracking is pronounced. A high-temperature time measurement can therefore move very little while the low-temperature behavior that causes cracking changes substantially. The GM number is least sensitive exactly where the failure mechanism lives. Quench oil water content is not a number a GM time can resolve into a risk category.
The same limitation applies to quench oil sludge and varnish and to polymer bath condition. A GM time may show a drift; it does not show the shape of the drift. And for quench oil acid value cracking distortion, the mechanism runs through the cooling curve: as acid value rises, the maximum cooling rate can increase, raising cracking and distortion risk. The causal chain is visible only when the curve is recorded, not when it is reduced to a single endpoint.
Cooling curve analysis records the full temperature–time history of a heated probe quenched into the medium. The probe is typically an Inconel 600 cylinder, 12.5 mm diameter × 60 mm length, with a thermocouple at the geometric center—the geometry specified in ISO 9950 and ASTM D6200 for quench oils. From the recorded curve, the analysis extracts a standard set of parameters: maximum cooling rate (CRmax), temperature at maximum cooling rate, cooling rate at 300 °C, characteristic temperatures marking the start of boiling and convection, and time to cool to 600, 400, and 200 °C.
These parameters map onto failure modes in a way a single time cannot. The vapor blanket duration and the temperature at which boiling begins govern soft spots and hardenability. The 300 °C cooling rate governs the low-temperature window where cracking and distortion concentrate. The curve shape itself—a double peak or a step in the boiling-stage slope—can flag oil degradation or contamination that a max-rate number alone would miss. ASTM D3520’s own scope note points readers to ASTM D6200 as the additional comparison method for quenching speed characteristics, acknowledging that the two methods serve different levels of resolution.
The transition is visible in practice. Industry discussions describe shops moving from GM quench speed testing to ISO 9950 cooling curve analysis as the preferred method for characterizing quench severity. This is not a rejection of the GM method’s historical role; it is a recognition that cooling medium testing at the diagnostic level requires the pathway, not only the endpoint.
The KHR-A Quenchometer belongs to the cooling-curve side of this divide. It is manufactured to ISO 9950, supports testing in line with ASTM D6200 and ISO 9950, and uses the same Inconel 600 probe geometry as the standards define. Its output set is built around the parameters that drive quench-bath decisions: maximum cooling rate and its temperature, 300 °C cooling rate, characteristic temperatures, and time to reach 600/400/200 °C. It also stores multiple results and overlays curves for baseline comparison—so a tank’s current cooling profile can be read against its historical profile, not against a single remembered seconds value.
That places the KHR-A Quenchometer in a different category from a GM Quenchometer, even though both carry the word “quenchometer” in common usage. The GM Quenchometer answers a classification question. The KHR-A answers a diagnostic question: is this quenching medium for heat treatment still producing the cooling pathway this part needs, or has it drifted into a range that will produce soft spots or cracks? For a quenchometer for heat treat shop use—routine tank-side checks where the result has to drive a decision—that distinction is the difference between a number that reassures and a curve that explains.
The same logic applies to polymer quenchants. Polymer quenchant contamination refractometer error is a known problem: a refractometer reading can be distorted by contaminants, and the reading may indicate a concentration that does not match the actual cooling behavior. The definitive check is the cooling curve—recording the curve shows whether the concentration actually delivers the required quenching characteristics. A portable quenchant tester or a cooling curve tester for heat treat shop that produces a full curve closes the loop that a concentration reading opens.
| Question | GM Quenchometer (ASTM D3520) | Cooling Curve Analysis (ISO 9950 / ASTM D6200) |
|---|---|---|
| Is this oil fast, medium, or slow by classification? | Yes—seconds map to the speed band | Yes, but delivers more resolution than the classification requires |
| Has the oil changed at high temperature? | Yes—sensitive to high-temperature speed shifts | Yes—the high-temperature portion of the curve is recorded |
| Will this oil produce soft spots or low hardness after quenching? | No—the standard states it does not reliably predict metallurgical performance | Yes—vapor-stage behavior and the low-temperature profile are visible |
| Is this oil at risk of quench cracking causes or quench distortion control failure? | Not directly—the low-temperature region is not resolved | Yes—the 300 °C cooling rate and curve shape expose the risk |
| Has water in quench oil 0.1% or sludge/varnish altered the cooling pathway? | May show a drift, but not where or how | Yes—the curve shows the stage and magnitude of the change |
| Does the record satisfy a quality system that calls for cooling curve analysis? | No—a single time is not a curve | Yes |
Read the table by your question, not by instrument capability. A shop that only needs a supplier-facing speed classification can use ASTM D3520 as a screening tool. A shop that needs to decide whether a tank is still safe for a critical part—or to investigate why a batch cracked after a water leak or a polymer concentration drift—is asking a question that only the curve can answer. The cooling curve analysis vs GM Quenchometer choice is therefore not a contest between a “better” and a “worse” instrument; it is a choice between two different levels of evidence.
For a shop comparing quench oil testing lab vs in-house, the practical implication is direct. Sending a sample out for a GM time returns a classification; sending it out for a cooling curve returns a diagnostic profile. An in-house quenching monitoring system built around a portable cooling curve instrument—rather than a single-number tester—keeps that diagnostic capability at the tank, where the decision is actually made. On-site quench oil testing with a curve-producing instrument turns a periodic lab result into a routine control measurement, which is what multi-tank operations need.
The KHR-A Quenchometer is manufactured by Zhengzhou Kehui Technology (Kehui Group), founded in 1994. Kehui’s founder is a technical specialist in this field, and the company was the first domestic Chinese manufacturer to independently develop and manufacture quenching medium cooling performance testers. The KHR-A carries patent ZL 2008 2 0069148.0 and is designed for oil, polymer, water-based, salt, and gas quenching media. Kehui’s quenching detectors have covered approximately 95% of the Chinese domestic market, with an installed base spanning chemical, boiler, pressure vessel, engineering machinery, military, and nuclear power applications. With export capability, Kehui is extending the KHR-A Quenchometer into international markets where heat treatment operations are moving from single-number screening toward curve-based quenching media control.
The relevant point for a buyer comparing methods is this: the KHR-A is not a GM-style time tester with a different label. It is a curve-producing instrument built to the same probe and standard basis as the cooling curve methods this article has described. Its design center is the tank-side decision—what the curve says about whether the medium still matches the part.
The word “quenchometer” does not tell you what an instrument measures. What it outputs tells you. A single time is a classification. A curve is a diagnosis. ASTM D3520 drew its own boundary when it stated that the method “does not reliably predict metallurgical performance.” Cooling curve analysis exists on the other side of that boundary because soft spots, cracking, distortion, and contamination-driven drift are not visible in a high-temperature endpoint time.
If your current quench oil testing consists of a speed number and a visual check, the useful next question is not “what number should this oil read?” It is “what does this oil’s curve look like at 300 °C, and has that curve moved?” That is the question the KHR-A Quenchometer is built to answer—and it is the question that separates a monitoring habit from a quality control system.
No. The KHR-A is a cooling curve analysis instrument built to ISO 9950 and ASTM D6200. It uses the Inconel 600 probe and records the full temperature–time curve, not the nickel-ball Curie-point time of ASTM D3520. If your quality system still requires a GM quench speed number alongside a cooling curve, the two tests are run on separate instruments; the KHR-A covers the curve-based method.
It depends on the question the shop needs answered. If the requirement is a supplier-facing speed classification or a quick screen for gross oil changes, ASTM D3520 is fast and inexpensive. If the requirement is to decide whether a tank is still safe for a critical part, to investigate soft spots or cracking, or to satisfy a quality system that calls for cooling curve records (CQI-9, AMS2759, NADCAP), then cooling curve analysis is the method that produces the needed evidence. Many shops run GM as a screening step and the cooling curve as the diagnostic step.
A single measurement follows the standard heat-quench-record sequence: the probe is heated to the specified austenitizing temperature, quenched into the medium, and the cooling curve is recorded at up to 1,000 readings per second. The measurement itself is short; the practical time depends on probe handling and the number of tanks being checked. The KHR-A stores up to 64 results and can overlay four curves on one chart for direct comparison against a baseline.
The KHR-A is designed for oil, polymer, water-based, salt, and gas quenching media. For polymer baths, the cooling curve is particularly useful because refractometer readings can be distorted by contamination and may not reflect actual cooling behavior. The curve shows whether the concentration in the tank is delivering the quenching characteristics the part requires.
The KHR-A reports maximum cooling rate and its temperature, cooling rate at 300 °C, upper and lower characteristic temperatures, and time to cool to 600/400/200 °C. For cracking and distortion risk, the 300 °C cooling rate is the parameter most directly tied to the martensite transformation window. A maximum cooling rate that looks acceptable can still conceal a low-temperature cooling rate that is too fast for the part.
Yes. Kehui has export capability and supplies the KHR-A with the documentation required for import clearance and calibration verification. For buyers comparing an on-site quench oil testing equipment option against sending samples to an external lab, the KHR-A is configured for tank-side measurement with record storage, so the measurement history stays with the shop rather than in a third-party report.
Zhengzhou Kehui Technology Co., Ltd
Email: info@zzkehui.com





 Chinese
 English
 OA
 Current location:
 Concrete Mixer Drum Robotic Welding Solutions
 Automobile Body Production Line Welding Fixtures
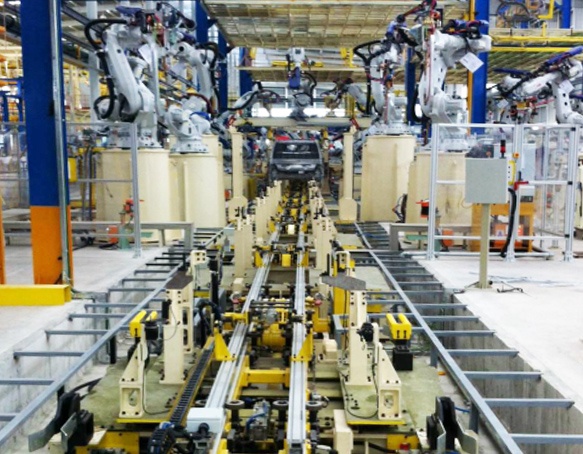 Automotive Body Welding Automated Manufacturing Solutions
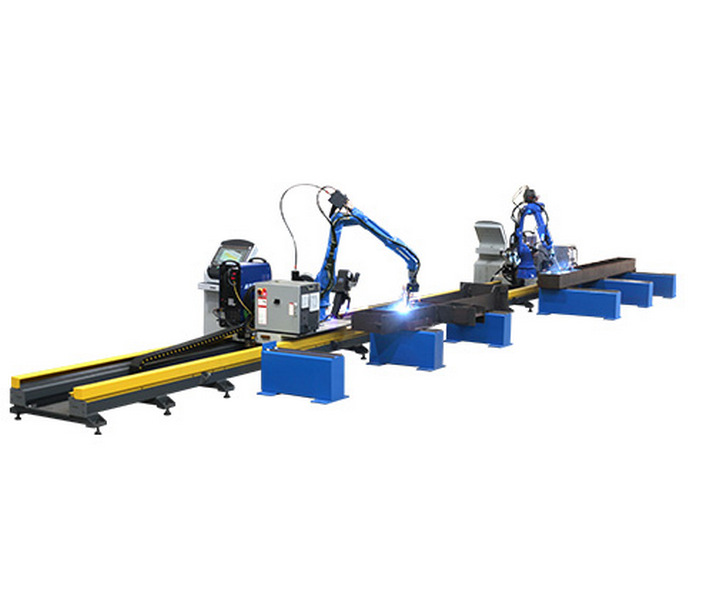 Free-Teaching Programming Welding Robot Cell For I Beam Welding
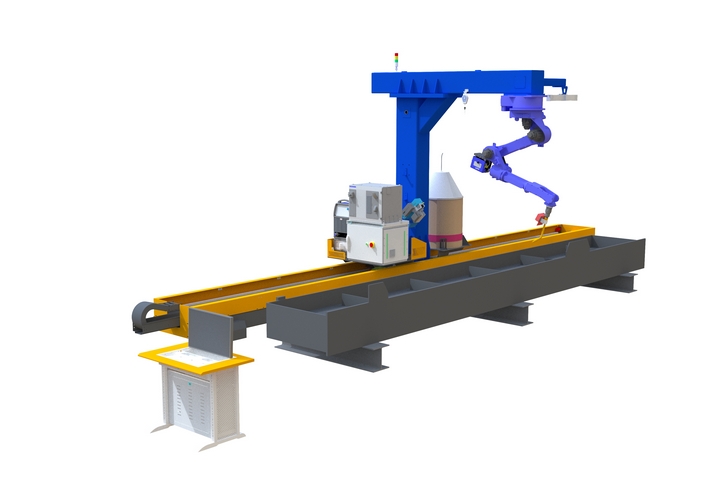 No Programming Required Robotic Welding Systems for H beam Welding Line