+86 15633683072
Comparing a Quenchtest-class portable unit, a SmartQuench-class analyzer, and the KHR-A quenchometer for a heat-treat shop? All three belong to the same product family—portable cooling curve testers built on the ISO 9950 probe philosophy—but they differ sharply in software depth and in how much of that depth a shop-floor operator will actually use. The KHR-A quenchometer sits on a third coordinate: portable, on-site, decision-oriented, and for routine quench-bath monitoring the more direct fit.
A note on terminology. Here, Quenchtest refers to the first-generation portable cooling curve tester category, and SmartQuench to the smart, software-driven analyzer category that followed. IVF introduced both product lines and remains their reference implementation—but the categories now include instruments from other manufacturers, including the KHR-A quenchometer discussed here. The comparison is between product logics, not brand loyalties. For any shop managing quenching media in heat treatment, the category choice ultimately determines how much of the cooling curve you can act on.
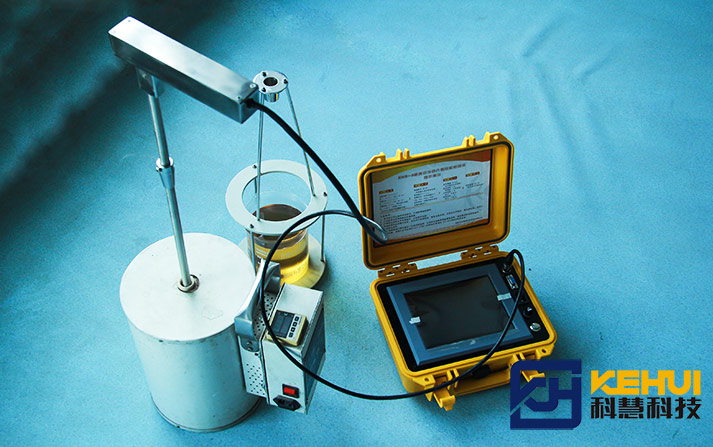
In heat-treat forums and supplier shortlists, the KHR-A quenchometer is routinely mentioned alongside SmartQuench-class analyzers when a shop asks about cooling curve equipment. That reflects a real overlap: instruments in all three categories use the Inconel 600 cylindrical probe, 12.5 mm × 60 mm, with a Type K thermocouple at the geometric center, the geometry underpinning ISO 9950 and ASTM D6200. When probe and heating protocol are identical, the comparison rightly moves to what happens after the curve is captured: how deep the analysis goes, and how easily it can be done where the tank actually sits.
The cooling curve is not a single number. It is a three-stage thermal history—vapor blanket, nucleate boiling, convection—and each stage maps to a different failure mode. An instrument reporting only “maximum cooling rate” leaves most of that history unread.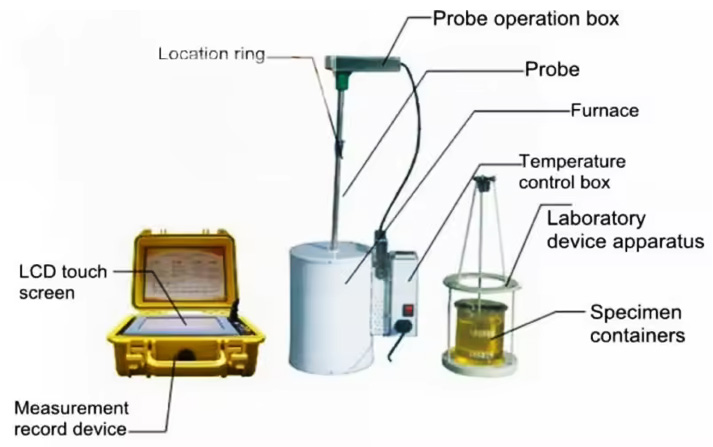
The Quenchtest-class instrument moved cooling curve testing out of the laboratory and into something a heat treater could perform as a routine check. The category was defined around ISO 9950—the same standard defining the Inconel 600 probe method used today—and the IVF Quenchtest, introduced in 1985, became its reference implementation.
Its contribution was methodological. Before this category existed, cooling curve characterization was a laboratory exercise tied to research equipment and specialist operators. The Quenchtest-class unit made the portable cooling curve test practical: heat the probe, quench it, record the temperature-time history. That loop remains the core of every instrument in this family, including the KHR-A quenchometer.
What the first-generation category did not do is where the second generation begins. Mid-1980s electronics limited onboard storage, signal processing, and post-measurement analysis. A Quenchtest-class instrument told you what the curve looked like; it did not calculate heat transfer coefficients, predict hardness, or filter noise at the level a process engineer wants when comparing quenchants side by side. For a stable single-quenchant line that limitation may never surface. For a shop qualifying a new polymer or chasing a batch of soft spots, the gap between “recording” and “analyzing” becomes decisive.
The SmartQuench-class analyzer, which emerged in the early 2000s, is a more powerful analytical platform than the Quenchtest-class unit—its advantage is not the probe or measurement loop, but the software layer above the curve. The IVF SmartQuench, introduced in 2003 as the SQ2, is the category’s reference implementation.
The hardware changes matter: a handheld acquisition unit (167 × 105 × 34 mm, 700 g), wireless Bluetooth transmission to a PC within roughly 10 m indoors, and storage for multiple measurements. Wireless is not cosmetic—it removes the grounding problems and cable routing that make on-site measurement awkward when the tank sits in a production cell.
The decisive capability is analytical. SmartQuench-class software plots the temperature–time and cooling rate–temperature curves, applies high-performance smoothing, and calculates CRmax, CRT, tp, Tvp, Tcp, and HP. With an optional advanced module—SQIntegra in the IVF implementation—the category goes further: heat transfer coefficient (HTC) calculation and prediction of hardness and microstructure distribution in cylindrical specimens.
That is the real dividing line. HTC and hardness prediction let an engineer connect a measured curve to the cross-section hardness pattern a part will likely develop, and compare quenchants before committing a production lot. For a quenchant supplier, corporate lab, or aerospace supplier building a CQI-9 or NADCAP evidence package, that depth is why this category exists.
It is also why a shop-floor operator may not extract its full value. A SmartQuench-class platform assumes a PC, the software environment, and a user who goes beyond the built-in pass/fail view. If the daily question is “is this tank still inside its window,” the instrument is doing more than the task requires—and the operator may default to the simplest reading, effectively using a second-generation platform as a first-generation recorder.
The KHR-A quenchometer is not a scaled-down SmartQuench-class analyzer. It is a different design logic within the same product family: measurement and decision support designed around the quench tank, not the laboratory bench.
The KHR-A is manufactured to ISO 9950, uses the same Inconel 600 probe geometry (600 mm overall probe length), and records the cooling curve at up to 1,000 readings per second, with measurable maximum cooling rate of 2,000 °C/s and temperature control accuracy of ±1 °C. It weighs approximately 3 kg and is built for on-site use in the quench area as well as laboratory-standard measurement.
What distinguishes the KHR-A quenchometer from both earlier categories is the output it prioritizes. Instead of leading with raw curve data and optional modules, it surfaces the parameters mapping directly onto quench-bath decisions: maximum cooling rate and its temperature, cooling rate at 300 °C, time to cool to 600/400/200 °C, and upper and lower characteristic temperatures.
Those parameters answer the two questions a heat treater asks about a tank: “Does this medium still harden the part?” and “Is it now more likely to crack it?” The measured maximum cooling rate is checked against the workpiece’s critical cooling rate to judge hardenability; the 300 °C cooling rate is checked against the workpiece’s crack-safe cooling rate to judge cracking tendency. The instrument stores up to 64 results and overlays four curves on one chart—a tank against its baseline, or two baths side by side.
That is the KHR-A’s position within the cooling curve tester family: calibrated to the routine monitoring decision, not the exceptional deep-analysis project. For a commercial heat treater whose quality system requires periodic cooling curve checks across multiple tanks, the value is how little stands between operator and decision.
The useful question is not which category “wins,” but where your quench line sits on two axes: on-site inspection vs. laboratory-depth analysis, and routine monitoring vs. investigative analysis.
| Quenchtest-class unit | SmartQuench-class analyzer | KHR-A Quenchometer | |
|---|---|---|---|
| Primary design logic | Portable cooling curve recording | Analytical cooling curve platform | On-site quench-bath monitoring and decision support |
| Probe / standard basis | ISO 9950, Inconel 600 | ISO 9950, Inconel 600 | ISO 9950, Inconel 600; supports ASTM D6200 and ISO 9950 |
| Data transmission | Early-generation onboard recording | Wireless (Bluetooth) to PC | Handheld unit with PC data transfer; built for tank-side use |
| Analysis depth | Curve recording; limited post-processing | Full curve analysis; HTC and hardness prediction with advanced module | Direct output of max cooling rate, 300 °C cooling rate, characteristic temperatures, time-to-temperature; baseline comparison |
| Best-fit user | Stable single-line shop | Quenchant suppliers, corporate labs, audit-heavy supply chains | Commercial heat treaters, captive shops, multi-tank monitoring |
| Where it creates the most value | Establishing a portable measurement routine | Investigating why a quenchant behaves as it does | Deciding whether a tank is still inside its control window |
Read the table by use case, not feature count. A shop confirming a quench oil is still within its historical window does not gain proportional value from an HTC module. A quenchant developer comparing polymer formulations does not gain proportional value from a tank-side decision interface. The KHR-A quenchometer is the third coordinate because it treats the monitoring decision as the primary product—not as a stripped-down derivative of an analytical platform.
When a hot probe enters a quenchant, cooling passes through three stages: a vapor blanket stage, where a continuous vapor film insulates the surface and cooling is slow; a nucleate boiling stage, where the film collapses and vapor bubbles carry heat away fastest; and a convection stage, where the surface is below the boiling point and cooling proceeds by conduction and convection. The curve shape—where maximum cooling occurs, how long the vapor stage lasts, how fast the curve falls through the low-temperature region—determines whether a part hardens fully, distorts, or cracks.
For quenching media in heat treatment, cracking risk concentrates in the low-temperature region. The 300 °C cooling rate is the parameter most directly tied to the martensite transformation window: too high a rate raises cracking risk even when maximum cooling rate looks acceptable, and a blended or degraded oil often shows an abnormal boiling-stage slope—a double peak or step—that a single max-rate reading hides. That is why the KHR-A output set deliberately foregrounds the 300 °C cooling rate.
The comparison stays operationally honest here. A SmartQuench-class user with an advanced module can go further—calculating HTC and predicting the hardness profile behind that 300 °C behavior. A KHR-A quenchometer user reaches the same decision point—is this tank safe for this part—through comparison against a pre-established crack-safe 300 °C cooling rate. Analytical depth differs; the decision does not disappear.
The choice is shaped by how often the shop tests. Under CQI-9, in-use quench oil requires testing every six months, including water content, suspended solids, total acid number, viscosity, flash point, and a cooling curve. Aerospace and automotive supply chains frequently expect quarterly samples, and some high-stress lines monitor more often still.
Moving from annual testing to a quarterly or monthly cooling curve routine across multiple tanks shifts the criteria. The binding constraint stops being “how much analysis can this instrument produce” and becomes “how quickly can a trained operator obtain a reliable, comparable curve at the tank, without disrupting production.” That is the design center of the KHR-A quenchometer: portable, tank-side, direct-read output, with overlay against a stored baseline. A shop testing once a year can justify a laboratory-depth platform; a shop testing every tank every quarter needs a result readable by a shift supervisor rather than a metallurgist.
The KHR-A quenchometer is manufactured by Zhengzhou Kehui Technology (Kehui Group), founded in 1994. Its founder is a technical specialist in this field, and Kehui was the first domestic Chinese manufacturer to independently develop and manufacture quenching medium cooling performance testers. The KHR-A carries patent ZL 2008 2 0069148.0 and is designed for oil, polymer, water-based, salt, and gas quenching media.
Kehui’s quenching detectors have covered approximately 95% of the Chinese domestic market, and the company holds a leadership position within China’s heat treatment industry association. With export capability and an installed base spanning chemical, boiler, pressure vessel, engineering machinery, military, and nuclear power applications, Kehui is now extending the KHR-A quenchometer into international markets.
That background matters for one reason: the KHR-A is not a new entrant learning the measurement problem. It is a platform refined across a large domestic installed base where multi-tank monitoring is standard practice. For overseas buyers, the productive framing is not “which brand is more established”—IVF’s contribution to both categories is real—but which instrument’s design center matches the monitoring rhythm of the shop.
The first-generation portable category dates to 1985, with the IVF Quenchtest as its reference implementation. Its electronics predate the wireless transmission and software analysis that define the SmartQuench generation. Shops still running a Quenchtest-class unit typically work within a stable, single-quenchant process; shops that have moved to multi-tank monitoring generally operate on a SmartQuench-class platform or an equivalent.
Software depth and data handling, not measurement principle. Both use the ISO 9950 Inconel 600 probe and the same heat-quench-record loop. A SmartQuench-class unit adds a handheld acquisition unit, wireless PC transmission, automated calculation of cooling curve characteristics, and—with an advanced module—HTC calculation and hardness/microstructure prediction.
They share probe geometry and standard basis, so raw curve data are directly comparable. The difference is design intent within the same product family: a SmartQuench-class platform is an analytical tool for laboratory-depth investigation; the KHR-A quenchometer is built for on-site, routine quench-bath monitoring, with direct output of the parameters that drive tank decisions.
Yes. It is manufactured to ISO 9950 and supports testing in line with ASTM D6200 and ISO 9950, the two standards defining cooling curve analysis for quench oils using the Inconel 600 probe system.
Maximum cooling rate describes peak heat extraction, but the 300 °C cooling rate governs the low-temperature region where martensite forms and cracking risk concentrates. Two quenchants with similar maximum cooling rates can behave very differently at 300 °C, and a degraded oil may show an abnormal boiling-stage curve that a single max-rate value does not capture.
For a shop building a quarterly or monthly monitoring routine across multiple tanks, the KHR-A quenchometer’s answer is: very little. For a quenchant developer or corporate lab investigating a formulation problem, a SmartQuench-class platform’s answer is: the right amount of depth. Both are correct—for different shops.
If you are unsure where your line falls on the coordinate, send us the workpiece type, the quenchant family, and the testing frequency your quality system requires. We will map your scenario against the three product categories and tell you which matches the way your quench line is actually run—not which has the longest feature list.
Zhengzhou Kehui Technology Co., Ltd
Email: info@zzkehui.com





 Chinese
 English
 OA
 Current location:
 Concrete Mixer Drum Robotic Welding Solutions
 Automobile Body Production Line Welding Fixtures
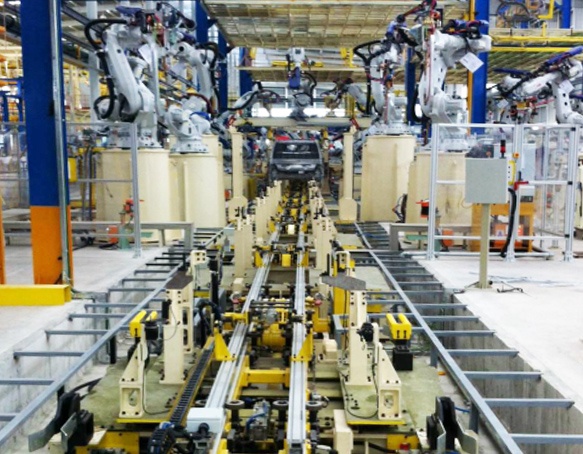 Automotive Body Welding Automated Manufacturing Solutions
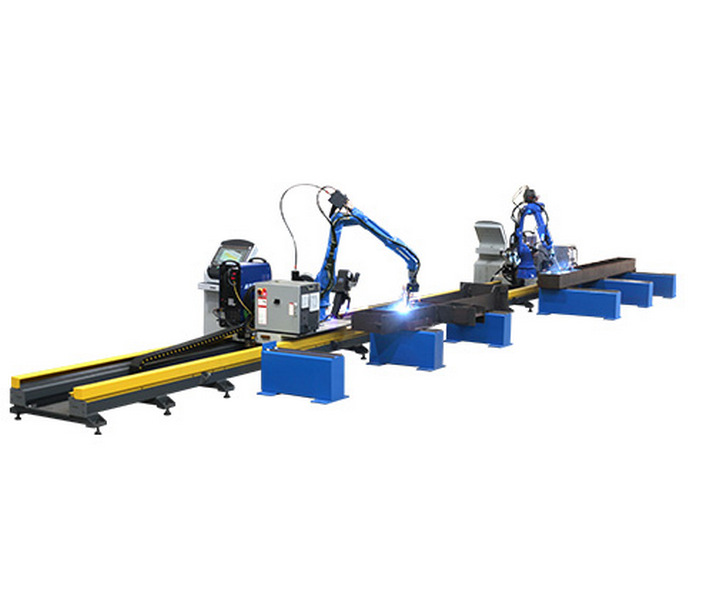 Free-Teaching Programming Welding Robot Cell For I Beam Welding
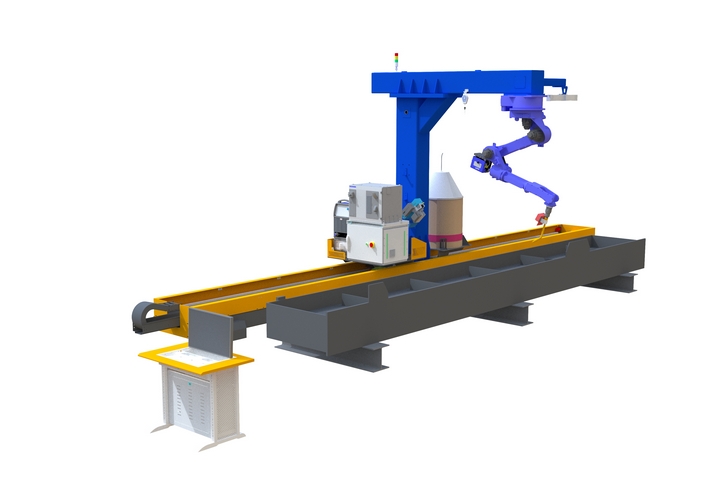 No Programming Required Robotic Welding Systems for H beam Welding Line