+86 15633683072
In commercial heat treatment, automotive powertrain manufacturing, and aerospace metallurgy, achieving repeatable part hardness while keeping distortion within tight tolerances is an everyday engineering challenge. Simply monitoring bath temperature is never enough—two quench tanks at the exact same temperature can produce vastly different metallurgical results depending on oil oxidation, water contamination, or polymer concentration.
When evaluating the cooling performance of quenching oils and polymer quenchants, metallurgists rely on a standardized Quenchometer compliant with ASTM D6200 and ISO 9950. Whether your facility benchmarks baths with an established SmartQuench system or a modern laboratory analyzer, understanding how to interpret the resulting curves is essential for daily quality control.
With the fundamentals of a quench cooling curve explained below, your engineering team can directly link curve shifts to part performance on the shop floor.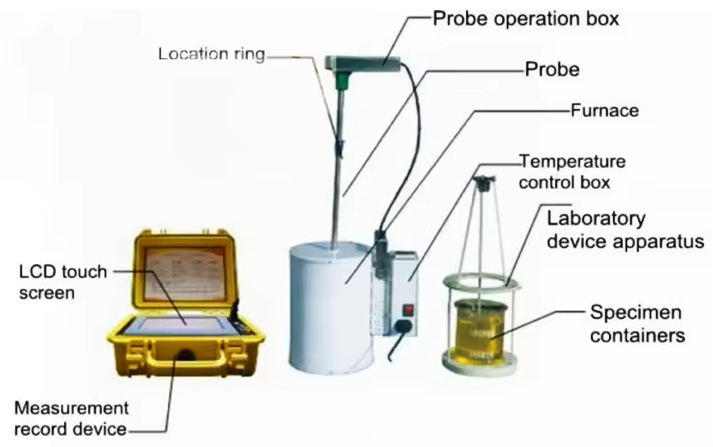
During a standard cooling curve test, a cylindrical Inconel 600 alloy probe with a Type-K thermocouple at its geometric center is heated to 850°C (1562°F) and rapidly immersed into a static or agitated quenchant sample. A high-frequency Quenchometer records the thermal decay and generates two complementary plots—the T-t curve and v-T curve:
Temperature-Time ($T\text{-}t$) Curve: Displays probe core temperature (°C) versus elapsed time (seconds). Process engineers use this curve to verify critical time intervals, such as the time required to cool from 850°C down to 600°C, 400°C, and 200°C.
Cooling Rate-Temperature ($v\text{-}T$) Curve: Calculated as the first derivative ($dT/dt$) of the T-t curve and v-T curve dataset, this graph plots instantaneous cooling rate (°C/s) against probe temperature. Because it magnifies subtle inflection points, the $v\text{-}T$ curve is the primary tool for diagnosing quenchant degradation.
When hot steel enters a liquid bath, heat extraction occurs in three distinct physical regimes visible on every $v\text{-}T$ plot:
Physical Mechanism: Upon initial immersion, intense surface heat vaporizes the surrounding liquid, enveloping the component in a continuous, insulating gas film. Heat transfers slowly via radiation and conduction across this vapor layer. Understanding the vapor blanket phase in quenching is critical because it governs the initial thermal shock before rapid cooling begins.
Key Curve Parameter: Vapor Blanket Rupture Temperature ($T_{vp}$), also known as the Leidenfrost point.
Industrial Impact: Oil oxidation or trace water contamination can destabilize or prolong the vapor blanket phase in quenching. In bearing and gear hardening, an extended vapor stage delays cooling through the pearlite nose of the TTT diagram—causing localized soft spots, low surface hardness, and premature wear in heavy-duty bearings and transmission gears.
Physical Mechanism: Once the metal surface cools below $T_{vp}$, the insulating vapor film collapses. Liquid contacts the hot steel directly, triggering violent nucleate boiling phase heat transfer. Millions of vapor bubbles rapidly form, detach, and carry away massive amounts of latent heat.
Key Curve Parameter: Maximum Cooling Rate ($CR_{max}$) and the Temperature at Maximum Cooling Rate ($T_{max}$).
Industrial Impact: The nucleate boiling phase delivers the fastest heat extraction required to bypass non-martensitic transformations. In lubricant & quenchant formulation, R&D chemists analyze $CR_{max}$ shifts to optimize speed-improver additives, ensuring that low-hardenability alloy steels achieve full core martensite without requiring harsh water quenches.
Physical Mechanism: When surface temperature falls below the quenchant's boiling point, boiling ceases entirely. Heat dissipation slows dramatically and is governed solely by liquid fluid flow, defined by the convection cooling rate.
Key Curve Parameter: Cooling Rate at 300°C ($CR_{300}$)—which closely coincides with the Martensite Start ($M_s$) temperature of most engineering steels.
Industrial Impact: While high speed is desired during boiling, controlling the convection cooling rate is vital for dimensional stability. During martensitic transformation, lattice expansion occurs simultaneously with thermal contraction. If $CR_{300}$ is excessively fast—often seen in degraded polymer baths or over-agitated tanks—steep thermal gradients trigger severe distortion, out-of-roundness, or quench cracking in precision automotive powertrain manufacturing shafts and thin-walled aerospace metallurgy fasteners.
| Cooling Curve Parameter | Governing Stage | Common Root Cause of Deviation | Resulting Metallurgical Defect |
| Extended Vapor Duration / Lower $T_{vp}$ | Stage A: Vapor Blanket | Oil oxidation, sludge buildup, or water ingress | Soft spots, pearlite/bainite pockets, low case hardness |
| Drop in Max Cooling Rate ($CR_{max}$) | Stage B: Nucleate Boiling | Additive depletion or improper polymer dilution | Incomplete hardening in thick cross-sections |
| Elevated Cooling Rate at 300°C ($CR_{300}$) | Stage C: Convection | Polymer thermal breakdown or excessive bath agitation | Dimensional warping, spline distortion, quench cracks |
Because cooling speeds during the transition into nucleate boiling can exceed 100°C/s within milliseconds, low-frequency data loggers often clip the true $CR_{max}$ peak—hiding early signs of bath deterioration. Furthermore, multinational manufacturers that already operate an installed SmartQuench system at headquarters require regional plants and suppliers to generate curves that follow identical ISO and ASTM sampling definitions for seamless data comparison.
Engineered in full compliance with ASTM D6200 and ISO 9950 standards, the KHR-A Quenchometer (Patent No. ZL 2008 2 0069148.0) uses a precision Inconel 600 probe assembly and high-speed signal conditioning to capture every inflection point across all three cooling phases. Its standardized $T\text{-}t$ and $v\text{-}T$ output parameters align directly with established industry benchmarks, giving heat treaters and lubricant suppliers reliable, repeatable diagnostics from the laboratory straight to the quench tank floor.
Looking to verify your current oil or polymer cooling curves against international standards? Contact our application engineering team to request a Sample ASTM D6200 / ISO 9950 Test Report from the KHR-A Quenchometer, or discuss how to integrate portable cooling curve testing into your facility's quality control workflow.
Both ASTM D6200 and ISO 9950 define the standard test method for evaluating the cooling performance of quenching oils and polymer quenchants under non-agitated (static) conditions using a 12.5 mm × 60 mm Inconel 600 probe heated to 850°C. While the core hardware specifications and test procedures are virtually identical, ISO 9950 is primarily referenced across European and international manufacturing standards, whereas ASTM D6200 is widely specified in North American commercial heat treatment and automotive standards. A compliant instrument like the KHR-A Quenchometer generates test reports that satisfy both standards simultaneously.
For high-volume operations in automotive powertrain manufacturing and bearing and gear hardening, baseline cooling curve testing is recommended once a month for stable oil baths, and weekly or bi-weekly for polymer quenchants (which are more sensitive to drag-out, evaporation, and thermal degradation). Immediate testing should also be performed after adding fresh makeup oil, detecting potential water leaks from heat exchangers, or observing unexplained part distortion or soft spots.
For most medium-carbon and alloy steels, 300°C lies directly within the Martensite Start ($M_s$) to Martensite Finish ($M_f$) transformation range. During this phase, the steel crystal lattice expands as austenite transforms into martensite. If the convection cooling rate ($CR_{300}$) is too rapid, steep temperature gradients between the surface and core create severe internal stresses—resulting in dimensional warping, out-of-roundness, or quench cracks.
Yes. Because both systems adhere strictly to the probe geometry, thermocouple placement, and sampling frequency mandated by ISO 9950 and ASTM D6200, the resulting T-t curve and v-T curve parameters—such as Maximum Cooling Rate ($CR_{max}$), Vapor Blanket Rupture Temperature ($T_{vp}$), and $CR_{300}$—are directly comparable. This allows multi-plant manufacturers and suppliers to standardize quality control across facilities using the KHR-A Quenchometer alongside legacy laboratory units.
Zhengzhou Kehui Technology Co., Ltd
Email: info@zzkehui.com





 Chinese
 English
 OA
 Current location:
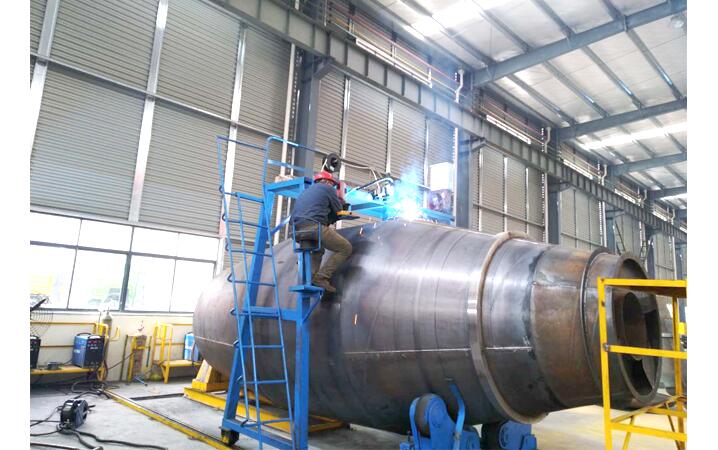 Concrete Mixer Drum Robotic Welding Solutions
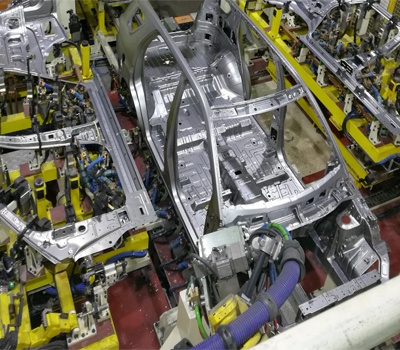 Automobile Body Production Line Welding Fixtures
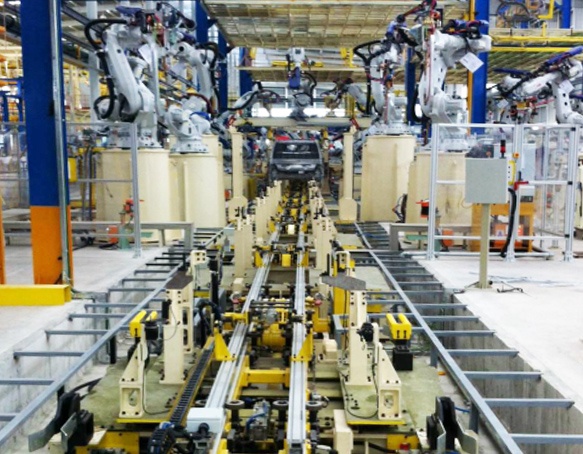 Automotive Body Welding Automated Manufacturing Solutions
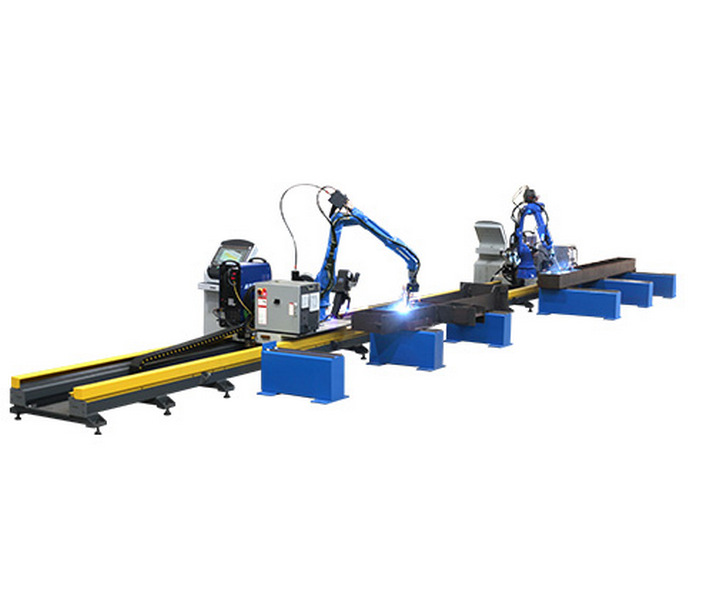 Free-Teaching Programming Welding Robot Cell For I Beam Welding
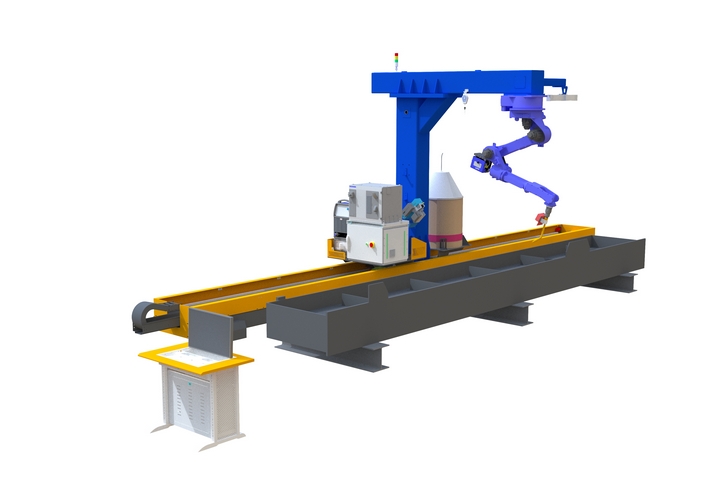 No Programming Required Robotic Welding Systems for H beam Welding Line