+86 15633683072
A batch of parts comes out of the quench with cracks, and the first instinct is “the cooling was too fast.” Then someone checks the maximum cooling rate on the oil certificate, and it sits comfortably inside the supplier’s range. The contradiction is not a measurement error. It is a category error: maximum cooling rate describes the high-temperature stage where the steel must avoid soft spots, while the crack seeds are planted in the low-temperature window where martensite forms. The two are different numbers on the same curve, and only one of them answers the cracking question.
This article sets out the quench cracking causes that belong to the cooling side of the process, separates thermal and transformation stress, and explains why the 300°C cooling rate—not the maximum cooling rate—is the parameter that maps onto crack risk. The instrument that reads that parameter is a cooling curve tester, and the KHR-A Quenchometer discussed below is built to compare the measured 300°C cooling rate against a workpiece’s pre-established crack-safe threshold.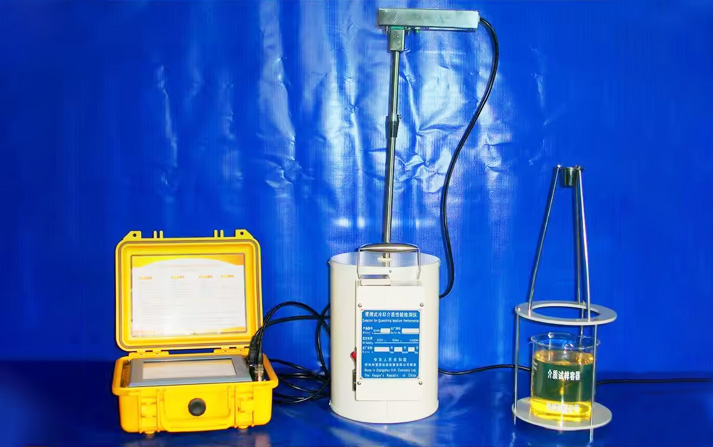
Quench cracking is the result of two stresses that peak at different moments and stack on each other.
Thermal stress arises from the temperature gradient between surface and core. The surface cools and contracts first; the core resists; tensile stress builds near the surface. Transformation stress arises when martensite forms: it is less dense than austenite, so it expands, and if the surface transforms before the core, the surface is pushed into tension while the core is still in compression. In a published failure analysis of an SAE 4140 housing, the crack surface carried a continuous oxide layer, placing initiation during quenching rather than in later machining; the peak tensile stress was concentrated at a thin-wall transition, and the mechanism was attributed to “excessive thermal and transformation stresses during quenching, amplified by asymmetric section thickness and unfavorable cooling conditions.”
The practical consequence is a split requirement. The high-temperature stage must cool fast enough to miss the pearlite and bainite noses—otherwise the part will not harden. The low-temperature stage must cool slowly enough to keep the tensile stress at the surface from exceeding the material’s fracture strength. Quench cooling is not “faster is better” or “slower is better.” It is fast where hardenability demands it, slow where cracking risk concentrates. The temperature window where that second requirement binds is the martensite transformation range, and in practical terms it is the region around and below 300°C. One patent document calls the 300–150°C interval the “quenching crack dangerous region” and notes that cooling at 5–40°C/s through it can initiate cracks. A fastener-industry formulation puts it directly: “if its cooling rate at 300°C is low, its ability to prevent bolt quenching cracks is strong.”
The maximum cooling rate typically occurs in the nucleate boiling stage, at a temperature well above the martensite start. It measures the medium’s ability to extract heat at peak, and it is the right number for answering “will this section harden?” It is the wrong number for answering “will this section crack?”
The reason is that the crack risk is set by the low-temperature cooling rate, especially around 300°C, where the martensite transformation is under way and the transformation stress is accumulating. Technical guidance on cooling curve interpretation states that “in the temperature range where martensite formation begins, the cooling rate should be low in order to minimize distortion and the risk of quench cracking.” Two quenchants can report the same maximum cooling rate and behave completely differently at 300°C—one safe, one cracking parts—because their low-temperature behavior differs even when their peak heat extraction is matched.
That is why the 300°C cooling rate is the operative parameter for quench cracking causes on the cooling side. It is also why a cooling curve tester that reports only a maximum rate leaves the cracking question unanswered. The diagnostic logic is to establish, in advance, the crack-safe cooling rate at 300°C for a given workpiece—by experiment, by experience, or by supplier data—and then compare the medium’s measured 300°C cooling rate against that threshold. Above the line, cracking tendency rises; below it, the medium is safe in the low-temperature window. This is the analysis logic built into the KHR-A Quenchometer: the measured 300°C cooling rate is compared against the pre-determined crack-safe rate for the workpiece, and the result is a judgment of the medium’s cracking tendency rather than a raw number left for the operator to interpret.
Polymer quenchants (PAG) achieve their cooling rate through concentration, bath temperature, and agitation. Lower concentration pushes the cooling behavior toward water—and water cools fast in the low-temperature window.
The consequence is documented in the quenching literature: “low concentrations of polymer quenchants can cause high stresses that can lead to cracking or distortion.” Low polymer concentration appears on the standard list of cooling-side causes for quench cracking and distortion, alongside excessive cooling rate and inadequate agitation. The mechanism is straightforward: a concentration below the process window raises the low-temperature cooling rate, and the 300°C cooling rate climbs toward and past the crack-safe threshold.
What makes concentration a particularly difficult variable is that it drifts. Water evaporates, polymer is dragged out on parts, and make-up water changes the balance. A refractometer reading can be distorted by contamination, so the number on the refractometer may not reflect the concentration that is actually producing the cooling behavior. This is where the cooling curve earns its place: it shows whether the concentration in the tank is delivering the 300°C cooling rate the part requires, independent of what the refractometer says. The contrast with soft spots is exact. In the soft-spot case, an unexpectedly high concentration leaves the section under-cooled. In the cracking case, a low polymer concentration raises the low-temperature cooling rate and pushes the part toward the crack-safe threshold. Same variable, opposite failure modes, and the cooling curve is what tells you which side of the window you are on.
Oil-based quenchants fail differently, but the diagnostic principle is the same: the changes that drive cracking may not appear in the maximum cooling rate.
Water contamination is the clearest example. Water in quench oil affects hardening response only slightly in some reports, but its effect on quench distortion and cracking is pronounced. Even small water content can alter the cooling curve’s low-temperature behavior while leaving the high-temperature peak largely intact. Oil contamination more broadly—salt, water, hydraulic oil, soot—is linked to cracking and distortion in service.
Oil degradation follows a similar pattern. Oxidation raises acid number and viscosity, produces sludge and varnish, and changes quench speed. These changes can reshape the cooling curve—particularly the boiling-stage slope and the low-temperature segment—without producing a corresponding move in the maximum cooling rate. A shop that monitors only the maximum rate can watch an oil age into a cracking regime while the headline number stays inside its band.
This is the argument for quench oil testing that includes a cooling curve rather than a single speed number: the curve records the segment where cracking risk lives. A quenchotest taken on-site, at the tank, against the oil’s earlier baseline, shows whether the low-temperature behavior has shifted. That is a different measurement from a water content titration or an acid number, and it is the one that connects oil condition to the quench cracking causes a shop is actually chasing.
Cracking is multi-causal, and the cooling curve is one step in a sequence, not a substitute for the rest.
The investigation should start with the cheapest, most physical variables. Part geometry—sharp corners, thin-to-thick transitions, asymmetric sections—concentrates stress and is the first thing to examine. Racking and fixturing determine whether cooling is uniform. Austenitizing temperature affects grain size, and coarse grains raise cracking susceptibility. Only after these have been checked does the medium become the prime suspect, and even then the question is specific: is the low-temperature cooling rate above the crack-safe threshold, and did it get there through concentration loss, water ingress, or degradation?
The KHR-A Quenchometer answers that specific question. It records the cooling curve to ISO 9950, supports testing in line with ASTM D6200 and ISO 9950, and reports the parameters that matter for this diagnosis: maximum cooling rate and its temperature, cooling rate at 300°C, upper and lower characteristic temperatures, and time to reach 600/400/200°C. It stores up to 64 results and overlays four curves on one chart, so the tank’s current low-temperature behavior can be read against its baseline. Its analytical logic is oriented toward the cracking decision: compare the measured 300°C cooling rate against the workpiece’s pre-established crack-safe rate, and judge whether the medium has moved into a cracking regime. It does not diagnose the crack, and it does not replace geometry or furnace checks. It measures whether the medium, on the cooling side, has crossed the line.
| Observation | More likely direction | 300°C cooling rate signal | Next action |
|---|---|---|---|
| Cracks at section transitions, sharp corners, thin-wall junctions | Stress concentration + uneven cooling | Curve may be normal overall; geometry amplifies local stress | Address part design or fixturing first, then re-check medium |
| Cracks scattered across a batch | Bulk low-temperature cooling rate too high, or concentration low | 300°C cooling rate above the crack-safe threshold | Check polymer concentration or oil condition; run a cooling curve against baseline |
| PAG bath, cracks with high hardness or distortion | Polymer concentration too low, low-temperature rate too fast | 300°C cooling rate elevated | Raise concentration into the process window; re-test to confirm the low-temperature rate falls |
| Oil bath, cracks increasing with service time | Oil degradation or water altering low-temperature behavior | Curve shape or 300°C rate shifted; maximum rate may be unchanged | Test water content and oil condition, plus a cooling curve to confirm the low-temperature shift |
| Cracks reduced but not eliminated after medium adjustment | Medium side improved; geometry or heating-side factor remains | 300°C rate moving toward the safe threshold but not yet there | Return to geometry, racking, and austenitizing checks; keep tracking the curve |
Read the table by the pattern you observed, not by the instrument on the shelf. A shop that changes the quenchant before checking geometry and racking has skipped the cheapest part of the investigation, and a shop that checks only the maximum cooling rate has skipped the part of the curve where the crack is decided.
The KHR-A Quenchometer is manufactured by Zhengzhou Kehui Technology (Kehui Group), founded in 1994. Kehui’s founder is a technical specialist in this field, and the company was the first domestic Chinese manufacturer to independently develop and manufacture quenching medium cooling performance testers. The KHR-A carries patent ZL 2008 2 0069148.0 and is designed for oil, polymer, water-based, salt, and gas quenching media. Kehui’s quenching detectors have covered approximately 95% of the Chinese domestic market, with an installed base spanning chemical, boiler, pressure vessel, engineering machinery, military, and nuclear power applications. With export capability, Kehui is extending the KHR-A Quenchometer into international markets where heat treaters are moving from single-number screening toward curve-based control of cracking risk.
For a shop working through quench cracking causes, the relevant claim is narrow: the KHR-A is a cooling curve tester that measures the 300°C cooling rate at the tank, against a stored baseline, and supports the comparison against a workpiece’s crack-safe threshold. It does not diagnose the crack for you. It gives the cooling-side part of the investigation a measurement where previously there was only an assumption that “the oil was within spec.”
No. Maximum cooling rate describes peak heat extraction in the high-temperature stage, which governs hardenability. Cracking risk is concentrated in the low-temperature window where martensite forms. A medium with a moderate maximum rate can still crack parts if its 300°C cooling rate is too high, and a medium with a high maximum rate can be safe if its low-temperature rate is controlled.
It is the maximum cooling rate at 300°C that a given workpiece can tolerate without cracking, determined by experiment, prior experience, or supplier data for that material and section. The medium’s measured 300°C cooling rate is compared against it. Above the threshold, cracking tendency rises; below it, the low-temperature cooling is within the part’s tolerance.
Yes. Low concentrations of polymer quenchants can produce high stresses that lead to cracking or distortion, because the cooling behavior moves toward water and the low-temperature cooling rate increases. Concentration is a cooling-rate variable, and a refractometer reading alone does not prove the bath is delivering the intended low-temperature behavior.
Water’s effect on hardening response can be modest while its effect on distortion and cracking is pronounced. Small water content can alter the low-temperature cooling behavior without a visible change in the oil. That is why quench oil testing for water content and a cooling curve are complementary: the titration gives the number, the curve shows what the water is doing to the quench path.
It records the cooling curve to ISO 9950 and ASTM D6200 and reports the 300°C cooling rate, maximum cooling rate and its temperature, characteristic temperatures, and time to reach 600/400/200°C. It stores results and overlays curves so the current low-temperature behavior can be compared against the tank’s baseline. The analysis logic compares the measured 300°C rate against the workpiece’s crack-safe threshold.
In common usage, both refer to probe-based cooling curve measurement of a quenchant. A quenchotest generally describes the portable test; a cooling curve tester is the instrument that performs it. A GM Quenchometer (ASTM D3520) is a different method that measures a single Curie-point time and does not produce a cooling curve.
Quench cracking causes on the cooling side come down to one question: did the low-temperature cooling rate cross the workpiece’s crack-safe threshold? Maximum cooling rate cannot answer it, because the maximum occurs in a different temperature region from the one where the crack is decided. Polymer concentration, water ingress, and oil degradation all act on that low-temperature window, and all of them can move it without moving the headline number.
The KHR-A Quenchometer exists to read that window. If you are chasing a cracking problem and have already checked geometry, racking, and austenitizing temperature, send us the workpiece material and section, the quenchant type and concentration or service age, and the crack locations you observed. We will tell you what the 300°C cooling rate should be compared against—not simply quote an instrument.
Zhengzhou Kehui Technology Co., Ltd
Email: info@zzkehui.com





 Chinese
 English
 OA
 Current location:
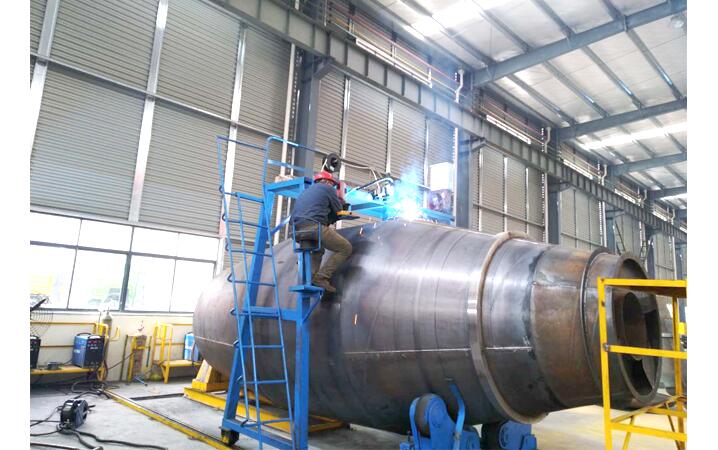 Concrete Mixer Drum Robotic Welding Solutions
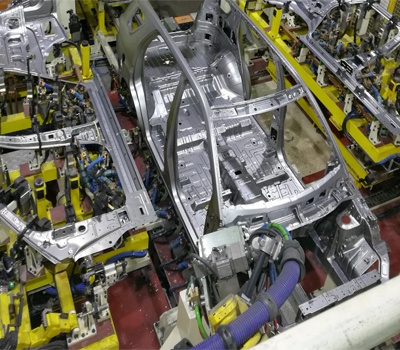 Automobile Body Production Line Welding Fixtures
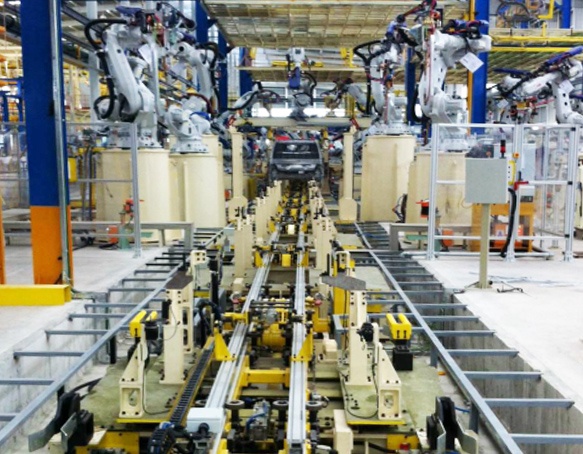 Automotive Body Welding Automated Manufacturing Solutions
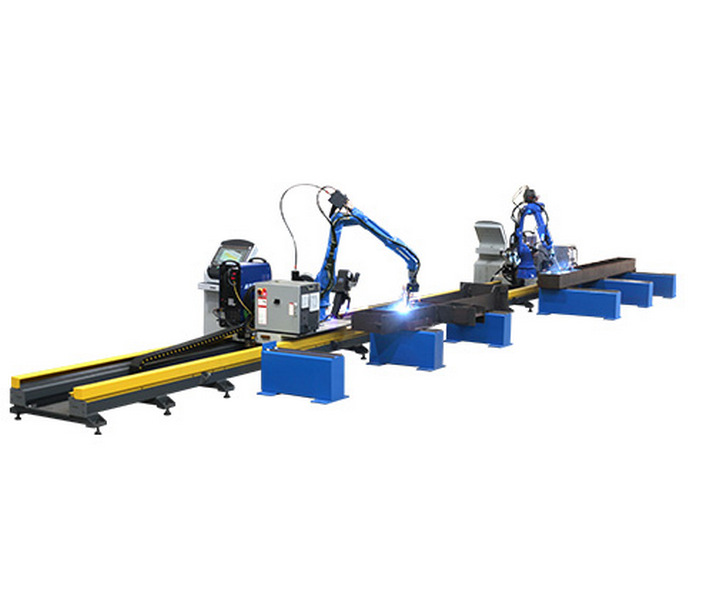 Free-Teaching Programming Welding Robot Cell For I Beam Welding
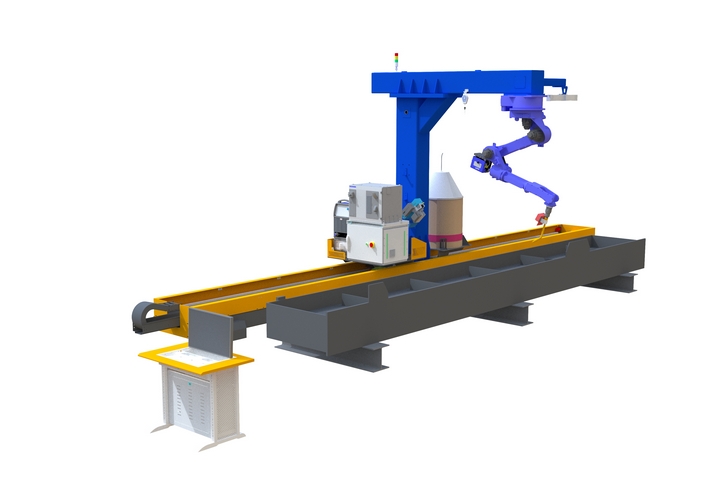 No Programming Required Robotic Welding Systems for H beam Welding Line